🧠 Key takeaways
Chromatin accessibility is a key determinant of cell identity, providing an orthogonal layer of information to gene expression profiles. It reflects the combined regulatory state of a cell, including DNA methylation, histone modifications, and transcription factor activity, which collectively influence gene expression and cell differentiation processes.
ScATAC-seq data is highly sparse due to the limited number of DNA copies per cell, leading to many features with zero counts. Defining biologically meaningful features, such as peaks or genome bins, is crucial for analysis, but it can be challenging to capture cell-type-specific accessibility.
Motivation
Every cell of an organism shares the same DNA with the same set of functional units referred to as genes. With this in mind, what determines the tremendous diversity of cells reaching from natural killer cells of the immune system to neurons transmitting electrochemical signals throughout the body? In the previous chapters, we saw that cell identity and function can be inferred from gene expression profiles in each cell. The control of gene expression is driven by a complex interplay of regulatory mechanisms such as DNA methylation, histone modifications, and transcription factor activity. Chromatin accessibility largely reflects the combined regulatory state of a cell, serving as an orthogonal layer of information to mRNA levels describing cell identity. Furthermore, exploring the chromatin accessibility profile enables additional insights into gene regulatory mechanisms and cell differentiation processes that might not be captured by scRNA-seq data.
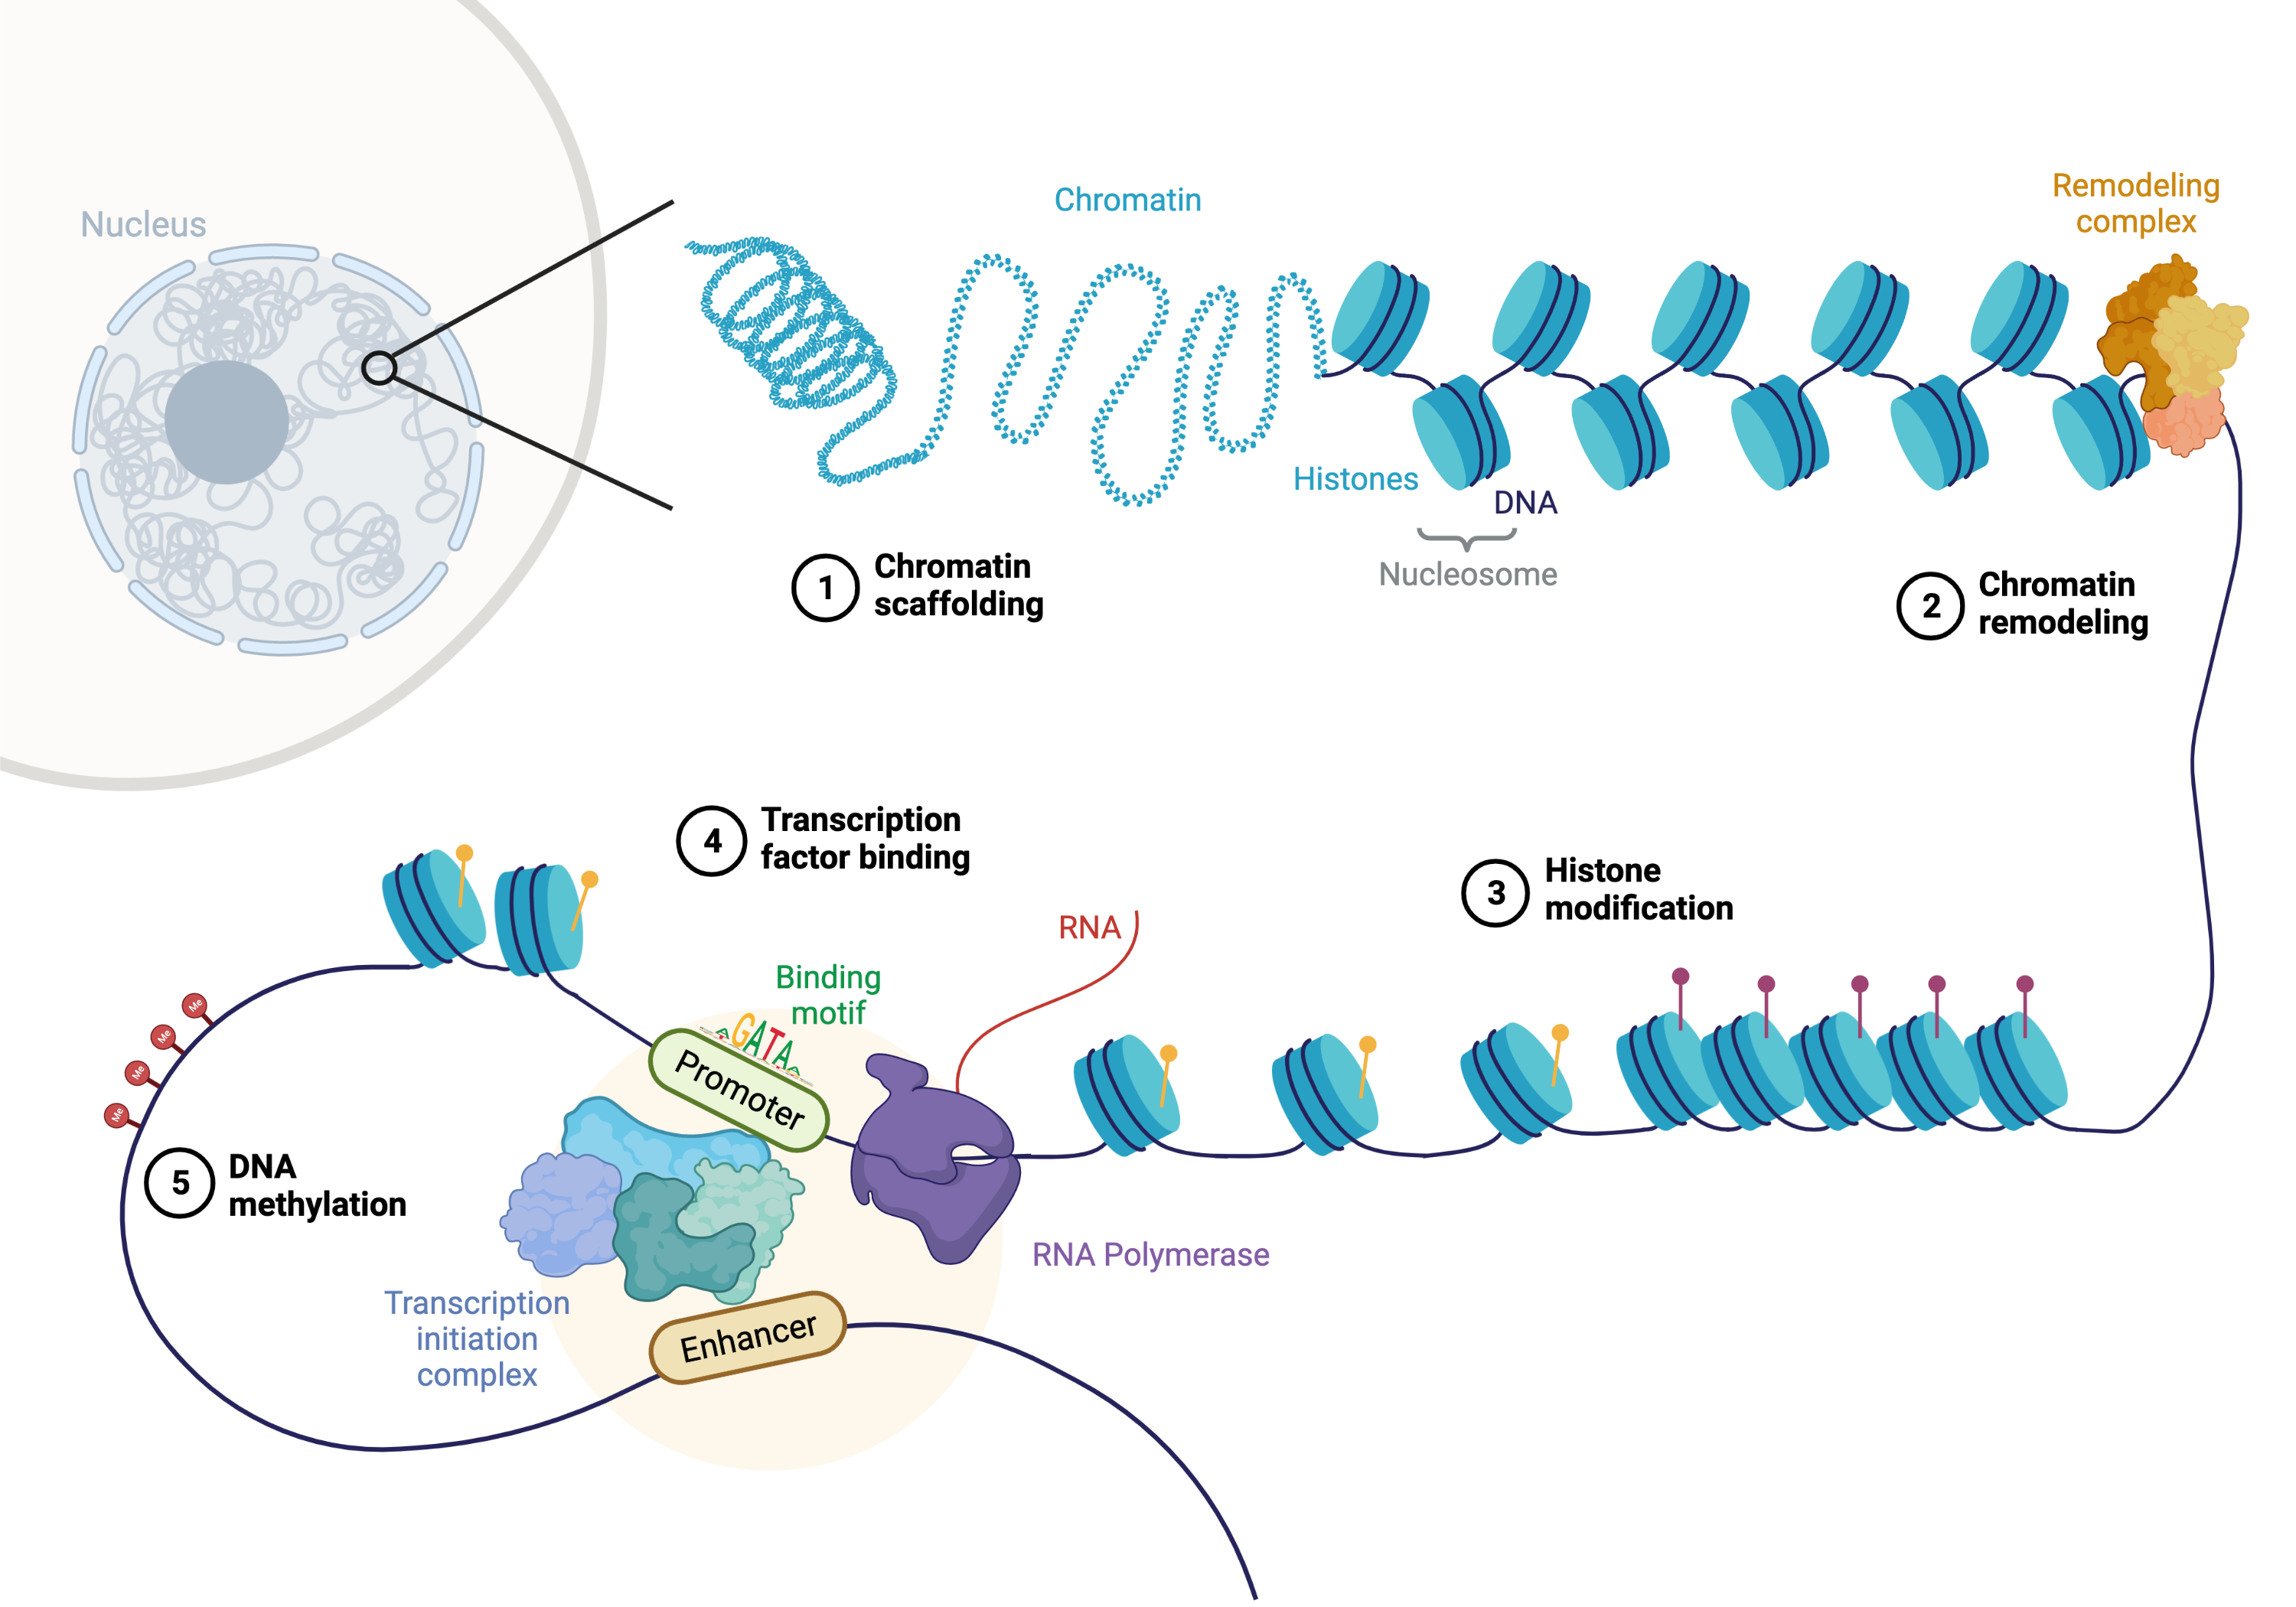
Figure 1:Overview of mechanisms influencing chromatin accessibility. Created with BioRender.com.
As depicted above, chromatin accessibility is influenced by higher-order structure down to low-level DNA modifications. (1) Chromatin scaffolding driven by scaffold/matrix attachment regions (S/MARs) and proteins in the nuclear periphery such as nuclear pore complexes (NPCs) or lamins influences chromatin compactness and gene expression Narwade et al., 2019Buchwalter et al., 2019. (2, 3) More local accessibility often referred to as densely packed heterochromatin versus open euchromatin can be actively controlled by ATP-dependent and ATP-independent chromatin remodeling complexes and histone modifications such as acetylation, methylation and phosphorylation. (4) Also the binding of transcription factors can influence nucleosome positioning and lead to the recruitment of histone-modifying enzymes and chromatin remodelers. (5) On a DNA level, methylation of CpG sites influences the binding affinity of various proteins including transcription factors and histone-modifying enzymes which combined leads to the silencing of the corresponding genomic regions. For an animated visualization we also recommend this 2 minute video on epigenetics and the regulation of gene activity (credits to Nicole Ethen from the SQE, University of Illinois). For a comprehensive and up-to-date review on genome regulation and TF activity, we refer to Isbel et al., 2022.
Taken together, an essential component defining cell identity is the regulatory state of each cell. In this chapter, we focus on chromatin accessibility data measured by the Single-Cell Assay for Transposase-Accessible Chromatin with High-Throughput Sequencing (scATAC-seq) or as part of the 10x Multiome assay (scATAC combined with scRNA-seq).
After walking you through the preprocessing steps this analysis will allow us to:
characterize cell identity with an orthogonal approach to scRNA-seq analysis
identify cell state specific transcriptional regulators
link gene expression to sequence features
disentangle epigenetic mechanisms driving cell differentiation and disease states
Experimental assay
Currently, commercially available kits are the most widely used experimental protocols and therefore we showcase our analysis on data generated with the 10x Multiome assay (with minor changes this also applies on data generated with the unimodal 10x single cell ATAC-seq assay).
The key principle used to measure chromatin accessibility is the Assay for Transposase-Accessible Chromatin with High-Throughput Sequencing. Starting point is a single cell suspension of the tissue of interest. Nuclei are extracted, and the transposition is performed in bulk using a Tn5-transposase which binds to open regions in the chromatin and generates tagmented DNA fragments. Nuclei are then loaded onto a 10x Chromium Controller and droplets containing gel beads and single cells, also referred to as Gel Bead-in-Emulsion (GEMs), are formed. Within each droplet, RNA molecules and DNA fragments are barcoded, and after dissolving the GEMs, nucleotide sequences are pre-amplified to receive the final scATAC-seq and scRNA-seq libraries.
In the figure below, we illustrate the fragmentation process of the scATAC-seq part Martens et al., 2022. scATAC-seq uses the Tn5 transposase enzyme to insert sequencing adapters into open chromatin regions of single cells, which results in the cleavage of DNA and the attachment of sequencing adapters to create Tn5 fragments. Two Tn5 insertions create one fragment with sequencing adapters, and the orientation of insertion is crucial as only fragments flanked with two distinct adapters can be captured and amplified. The amplified fragments are then sequenced paired-end and aligned to the reference genome.
Figure 2:ATAC-seq overview. Image obtained from Martens et al., 2022.
Data characteristics - feature definition and sparsity
Single-cell ATAC-seq data measures chromatin accessibility across the entire genome. Since this includes coding and non-coding regions, genes can not be used as pre-defined features, as is the case for scRNA-seq data. Instead, the most common approach to define biologically meaningful features is detecting regions of high accessibility compared to a background - i.e. peaks in the distribution of fragment counts along the genome. Peaks in coding regions indicate that a gene might be transcribed, while in non-coding regions, accessibility is seen as a prerequisite or result for the binding of regulatory proteins such as transcription factors. However, calling peaks on all cells of a dataset can hide cell-type specific accessibility or accessibility profiles of rare cell types. Therefore, a proposed solution is to call cluster-specific peaks which requires prior peak-independent clustering of the cells. SnapATACFang et al., 2021 and ArchRGranja et al., 2021 suggest a binning strategy, that creates features by dividing the entire genome into uniformly sized windows and using this feature set for clustering of the cells.
Once the feature set is defined in one or the other way, a measure of Tn5 activity in those features is defined for each cell. Three main approaches are used: counting reads overlapping a feature, counting fragments overlapping a feature, and binarization. While the 10x Genomics Cell Ranger ATAC pipeline counts reads overlapping peak regions, the widely used Signac framework Stuart et al., 2020 counts the number of fragments overlapping a feature. On the other hand, ArchR Granja et al., 2021 counts read ends and binarizes them by default.
It is important to note that there are some differences between counting reads and counting fragments. In scATAC-seq, paired-end sequencing generates two reads that are usually in close proximity to each other. As a result, uneven counts are only generated if one read pair lies outside the feature Martens et al., 2022. This means that the used counting strategy can impact the resulting count distribution. It has been shown that the read counting strategy leads to a count distribution with many more even than uneven counts while counting fragments does not have this effect Martens et al., 2022Miao & Kim, 2022.
Another important characteristic of scATAC-seq data is its high sparsity. Since there are only two copies of DNA in each cell in a diploid organism, the maximum number of counts for a given base-pair position is 2 (note that there can be more than two counts in a peak or bin since it is a long range). This can lead to many features having zero counts, resulting in a highly sparse count matrix. To account for this, some methods take the approach of binarizing the counts, which means that a feature is called accessible as soon as one read or fragment overlaps Granja et al., 2021Bravo González-Blas et al., 2019Bravo González-Blas et al., 2019Ashuach et al., 2022. However, binarization can result in a loss of information and can be less sensitive in detecting small differences in accessibility Martens et al., 2022.
It is important to note that the best counting strategy for scATAC-seq data is still under debate, and further independent benchmarking is needed. Ultimately, the choice of counting strategy will depend on the specific research question and the characteristics of the dataset.
Overview of the data analysis workflow
In the following sections, we will guide you through a standard workflow for analyzing scATAC-seq data. The accompanying overview figure presents the various stages of the analysis and highlights differences between popular frameworks used for this purpose. To begin with, we will explain the concepts of quality control and dimensionality reduction using Python and muon. Towards the end, we will demonstrate how to transfer your muon object to R and perform data visualization and interpretation using Signac.
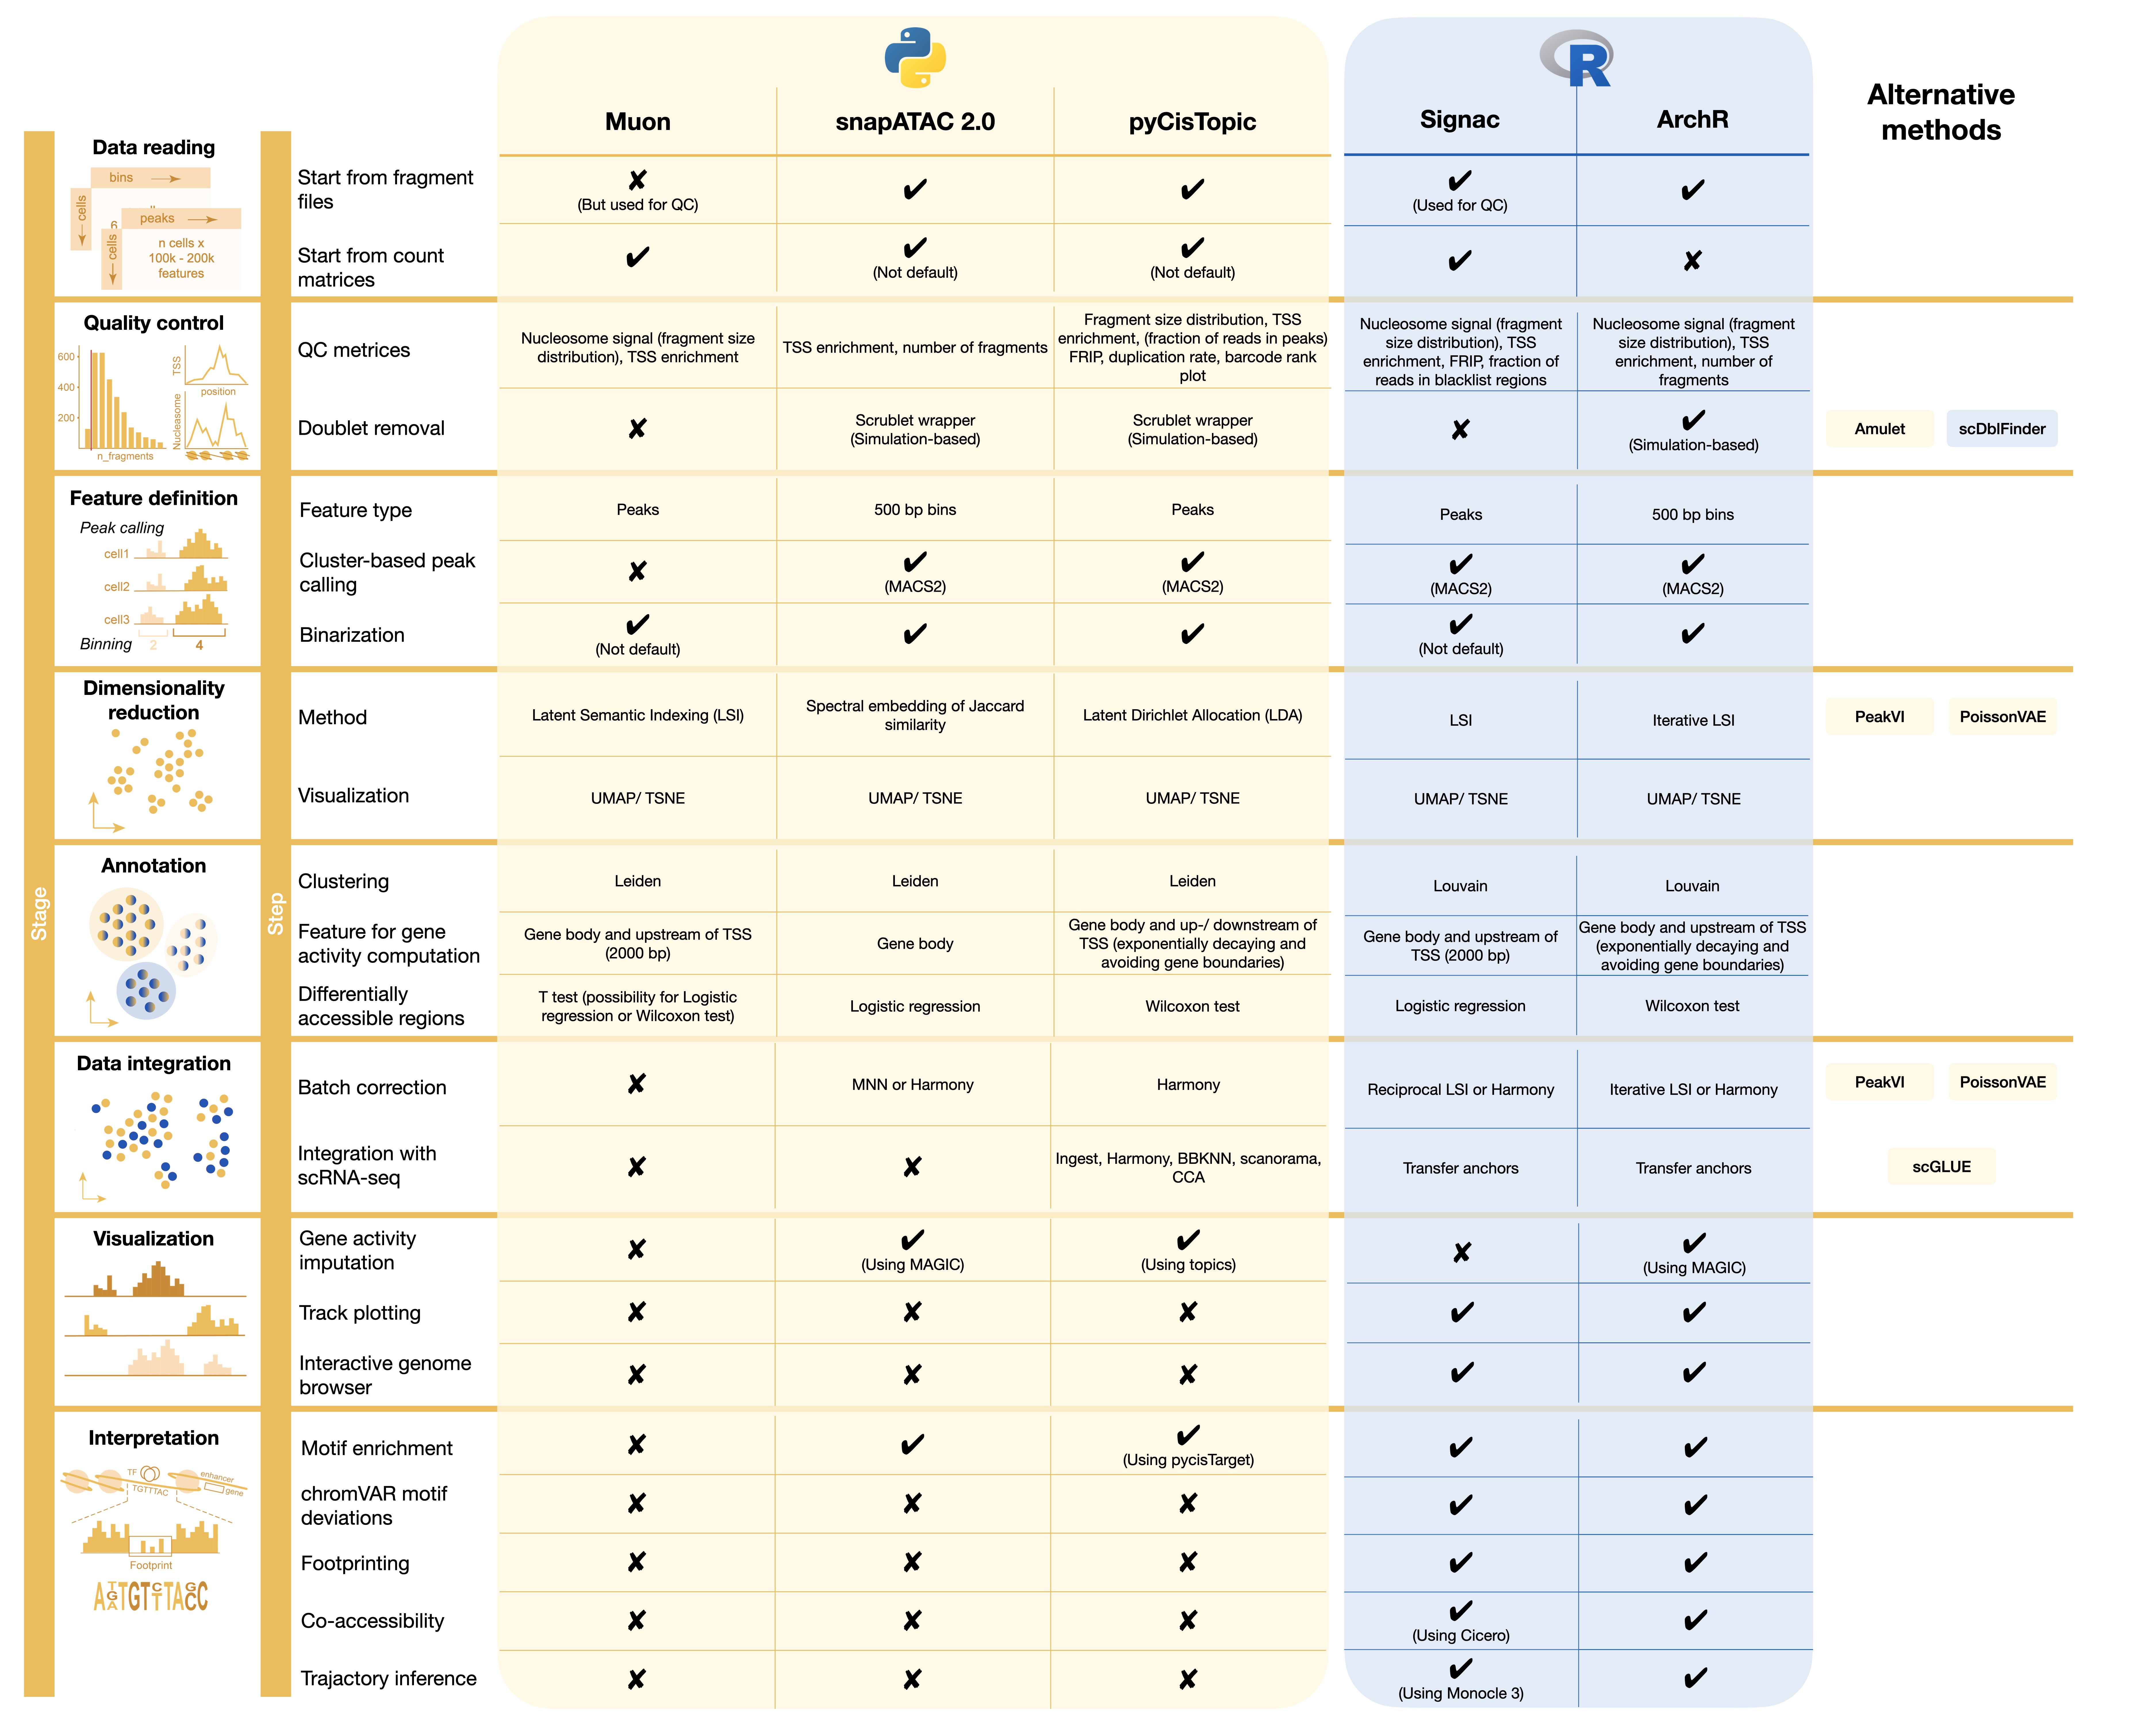
Figure 3:Overview of the scATAC-seq analysis steps.
Contributors
We gratefully acknowledge the contributions of:
Authors
Christopher Lance
Laura Martens
Reviewers
Lukas Heumos
- Narwade, N., Patel, S., Alam, A., Chattopadhyay, S., Mittal, S., & Kulkarni, A. (2019). Mapping of scaffold/matrix attachment regions in human genome: a data mining exercise. Nucleic Acids Research, 47(14), 7247–7261. 10.1093/nar/gkz562
- Buchwalter, A., Kaneshiro, J. M., & Hetzer, M. W. (2019). Coaching from the sidelines: the nuclear periphery in genome regulation. Nature Reviews Genetics, 20(1), 39–50. 10.1038/s41576-018-0063-5
- Isbel, L., Grand, R. S., & Schübeler, D. (2022). Generating specificity in genome regulation through transcription factor sensitivity to chromatin. Nature Reviews. Genetics, 23(12), 728–740. 10.1038/s41576-022-00512-6
- Martens, L. D., Fischer, D. S., Theis, F. J., & Gagneur, J. (2022). Modeling fragment counts improves single-cell ATAC-seq analysis. bioRxiv. 10.1101/2022.05.04.490536
- Fang, R., Preissl, S., Li, Y., Hou, X., Lucero, J., Wang, X., Motamedi, A., Shiau, A. K., Zhou, X., Xie, F., Mukamel, E. A., Zhang, K., Zhang, Y., Behrens, M. M., Ecker, J. R., & Ren, B. (2021). Comprehensive analysis of single cell ATAC-seq data with SnapATAC. Nature Communications, 12(1), 1337. 10.1038/s41467-021-21583-9
- Granja, J. M., Corces, M. R., Pierce, S. E., Bagdatli, S. T., Choudhry, H., Chang, H. Y., & Greenleaf, W. J. (2021). ArchR is a scalable software package for integrative single-cell chromatin accessibility analysis. Nature Genetics, 53(3), 403–411. 10.1038/s41588-021-00790-6
- Stuart, T., Srivastava, A., Lareau, C., & Satija, R. (2020). Multimodal single-cell chromatin analysis with Signac (p. 2020.11.09.373613) [Techreport]. bioRxiv. 10.1101/2020.11.09.373613
- Miao, Z., & Kim, J. (2022). Is single nucleus ATAC-seq accessibility a qualitative or quantitative measurement? (p. 2022.04.20.488960) [Techreport]. bioRxiv. 10.1101/2022.04.20.488960
- Bravo González-Blas, C., Minnoye, L., Papasokrati, D., Aibar, S., Hulselmans, G., Christiaens, V., Davie, K., Wouters, J., & Aerts, S. (2019). cisTopic: cis-regulatory topic modeling on single-cell ATAC-seq data. Nature Methods, 16(5), 397–400. 10.1038/s41592-019-0367-1
- Ashuach, T., Reidenbach, D. A., Gayoso, A., & Yosef, N. (2022). PeakVI: A deep generative model for single-cell chromatin accessibility analysis. Cell Reports Methods, 100182. https://www.sciencedirect.com/science/article/pii/S2667237522000376